
Introduction and Overview
This Sustainability and Impact report covers our third Sustainable Solutions Fund (SSF III), which closed with just over USD 1 billion of committed capital in 2019 and is now fully invested across 15 companies. In May, we also announced the final close of Sustainable Solutions Fund IV, bringing us to a total of USD 3.9 billion raised across four funds.
For the Growth Equity team, 2022 was a year of inward focus on the portfolio, strategic reflection and operational improvement. We continued to push forward on roadmaps, roundtables and events, authoring 13 roadmaps and assessed 52 qualified companies, across roadmap topics such as food systems, machine learning platforms, identity and anti-fraud, healthcare staffing, mental health and ESG & sustainability tools. In parallel to deal activity, we made intentional investments in our operating platform scalability and efficiency to drive future growth. These included a significant program of investment in our portfolio management approach, and process updates in response to changes in the regulatory landscape.
Growth Equity
Overview
Investment Strategy & Approach
Strategy
We invest in companies whose products, services and operations contribute to the global outcomes of Planetary Health, People Health and Financial Inclusion.
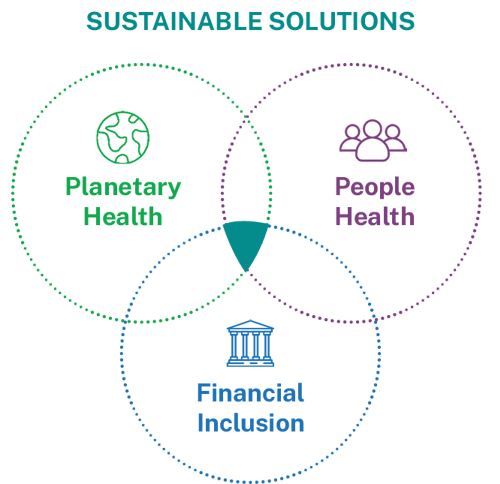
We seek to back companies that drive clear impact across our three outcomes domains, as detailed in the table below. Using our systems thinking lens, we also understand that these outcomes are often interrelated, and we take this into account in our investment research and evaluation – Planetary Health influences People Health and Financial Inclusion, and the other way around.
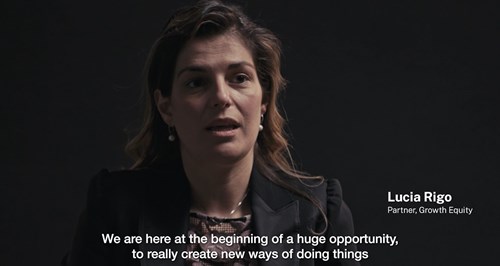
We believe this will be the defining decade for driving the transformational changes needed in climate and social action. Click on the video below to hear more from Lucia Rigo, Partner in Growth Equity.
Hear about The Defining Decade
Approach to Portfolio Impact and ESG Performance Measurement
We select at least one ‘North Star’ impact metric to measure each business’ contribution to the above goals, and report on outcomes mapped to the UN Sustainable Development Goals (SDGs), alongside core ESG performance metrics. For companies contributing to Financial Inclusion and People Health, we conduct social outcomes benchmarking using beneficiary surveys. For companies contributing to Planetary Health, we analyse their total environmental impact through Life Cycle Assessments (LCA). We also analyse our business’ overall contribution and risks to impact using the norms established by the Impact Management Project (IMP) framework. Finally, using GHG emissions measured as part of our core ESG performance metrics, we have also begun to engage our portfolio in reporting aligned to the Task Force on Climate-related Financial Disclosures (TCFD) and in setting Science-Based Targets (SBT), in line with Generation’s commitment to align our portfolio to net zero by 2040 or sooner.
Planetary Health |
People Health |
Financial Inclusion |
Reporting Frameworks: |
|
| Impact Outcomes |
GHG Mitigation Pollution Avoidance Resource Efficiency |
Access Health Outcomes System Cost Efficiency |
Access Individual Earnings Growth System Cost Efficiency |
|
| Impact Metrics |
|
|
|
|
| ESG Performance Metrics | Environmental, Social, and Governance (ESG) information captured across the portfolio |
|
||
Portfolio Results
We added two new investments into our portfolio in 2022: project44 and o9 Solutions. Compared to 2021, most Planetary Health companies performed strongly on product impact, with ‘tCO2e avoided’ increasing for three out of four companies that previously reported that metric. In contrast, product impact data for our People Health and Financial Inclusion companies was mixed. Three companies’ product impact results improved, while reported impact decreased for four companies; we are working with companies to understand the reasons. This year we also increased the granularity of our portfolio-wide ESG performance data framework, providing deeper insights to support companies in critical operational areas such as impact governance and human capital management. In 2023, the team is focused on ensuring our companies continue to deliver positive impact to beneficiaries and the environment alongside continued revenue growth.
Click on the logos below to read more about results from companies in the portfolio.
AlayaCare
What it Does
AlayaCare is a home care and home health care software provider, selling an all-in-one SaaS solution to over 700 customers across Canada, the US and Australia. Its flagship platform offers clinical (e.g., plan of care) and non-clinical (e.g., scheduling, workforce management) modules to home care agency stakeholders including office workers, schedulers, caregivers and patient families.
System Positive Thesis & Solution
According to the US Centers for Medicare and Medicaid Services, home health care is 98% and 86% cheaper than the cost of acute hospital care and the cost of care in a skilled nursing facility respectively, generally more convenient, just as effective and can lead to better outcomes.3 Further, optimisation of care provider routes can reduce emissions. We believe that a more efficient and effective health system is one with greater home care, and growing the home care market requires easier-to-use, comprehensive care platforms. AlayaCare is leading this change.
Impact Insights
- What. Generation supported AlayaCare’s second beneficiary survey, finding that 42% of care providers reported improved access to shifts and 19% reported decreased hospitalisation rates for clients4. This was a slight decrease vs. 2021, possibly due to a significant (~3x) increase in survey sample size, providing a more accurate picture of provider experiences. In 2022 Alayacare also released an upgrade to their caregiver mobile app.
- How. In 2022, Generation Chairman Al Gore attended an AlayaCare dinner and presented a speech the following night, underscoring the importance of home care to a sustainable healthcare system. We also helped Alayacare estimate the potential for reduction in CO2 from optimising care giver routing, with exciting early results – Alayacare's algorithm has shown it can reduce miles travelled by care givers by 37%.
Investment Detail
Year Invested
2021
Back Market
What it Does
Back Market is the largest online marketplace focused on refurbished consumer electronics, with nearly six million customers and 2,000 vendors worldwide.6 The company was founded in 2015 by three friends who had realised the positive environmental impacts of buying refurbished consumer electronics and launched a platform to remove the challenges that willing buyers experienced.
System Positive Thesis & Solution
With its sorting and curation technology and a clear consumer interface, Back Market brings price transparency, quality, trust and customer service in line with what consumers experience when buying a new device, removing frictions holding demand back. The company’s circular system also extends the lifetime and value of consumer electronics, and reduces carbon emissions, the pressure on raw materials and unsustainable sourcing (e.g., worker exploitation, environmental impacts).
Impact Insights
- What. We supported Back Market with a Lifecycle Assessment of its service, demonstrating that emissions avoided by Back Market amount to a substantial 314k tCO2e and 1,290 metric tonnes of e-waste avoided7. To support Back Market’s penetration of the US market, Generation helped organize a roundtable with C-suite executives at consumer electronics OEMs and mobile operators.
- How. Back Market obtained its B-Corp certification in March 2023. In March 2022, Back Market published its second Non-Financial Performance declaration related to its performance in 2021. Finally, to monitor commitment to its stakeholders, the company has named a Mission Committee with representatives from investors, employees, civil society, NGOs, business partners, and suppliers.
Investment Detail
Year Invested
2021

Benevity
What it Does
Benevity is a provider of corporate purpose SaaS, providing an integrated suite of community investment and employee, customer and non-profit engagement solutions that help large enterprise and mid-sized companies attract, retain and engage today’s diverse workforce, embed social action into their customer experiences and positively impact their communities.
System Positive Thesis & Solution
Corporate purpose is becoming an increasingly important topic on corporate agendas, and as both talent and customer attraction and engagement strategies. Yet, many companies lack the resources to offer comprehensive scalable solutions. Benevity solves this problem with a holistic solution that connects companies and their people with the causes they care about through an all-in-one platform that facilitates online donations, matching programmes, disaster/crisis relief support, flexible volunteering, community engagement, pro-social learning and actions, and the mobilisation of affinity groups and Employee Resource Groups. In this way, Benevity enables companies and their people to support causes critical to creating a more sustainable economy, such as climate change, social justice and health.
Impact Insights
- What. Generation continued to support Benevity in refining its theory of change and impact metrics in 2022. In 2022, Benevity helped 85% of clients build a stronger, more connected culture, an increase of eight percentage points from 2021. Benevity also began reporting ‘unique changemakers’, defined as individuals using the Benevity platform who have completed a micro-action in support of good causes, donated time or funds, which increased 33% to over 2.23M individuals in 20227
- How. Of note, Benevity has been a certified B-Corp since 2011, with a most recent score of 112.1. Generation also supported Benevity with client introductions through a client meeting in 2021.
Investment Detail
Year Invested
2021
Convoy

What it Does
Convoy is a digital freight marketplace that connects shippers with carriers to move hundreds of thousands of truckloads, saving money for shippers, increasing earnings and reducing hassle for carriers, and reducing carbon waste for the planet.
System Positive Thesis & Solution
Truck freight accounts for 7% of all US greenhouse gas (GHG) emissions, (i.e., 436.5 million tCO2e per year).9 Of this, 49% are booked as full truckloads, of which ~30-35% are empty miles, leading to 72 million tCO2e in avoidable emissions from this segment alone.10 By improving trucking utilisation, we believe that Convoy can deliver higher earnings for carriers, lower shipping costs and reduce both empty miles driven and carbon emissions.
Impact Insights
-
What. Generation continued to support Convoy’s calculation of their environmental impact, finding that 2022 saw 370k litres of fuel saved and 990 tCO2e of avoided emissions11. This was a slight decrease from last year, despite net revenue growth, as Convoy reported slightly lower total shipments and a lower percentage of batched shipments.
-
How. In 2022, Convoy released a Freight Insights Report to assist others with improving facility performance, and welcomed a new Board member, Mark Mondello, previous CEO and current Executive Chairman of Jabil. in March 2023, Convoy released its Emissions Insight Dashboard, providing shippers on Convoy’s network real time tracking of their Scope 3 emissions.
Investment Detail
Year Invested
2019

Elation Health
What it Does
Elation Health is a healthcare technology company powering the future of independent primary care. The company works with 24,000 independent clinicians serving more than 12.8 million patients across the US.12 Elation’s clinical-first roots, value-based tools, application programming interfaces (APIs) and data exchange tools enable organisations to shift to value-based care (VBC) and to transform the patient and provider experience.
System Positive Thesis & Solution
In the US, primary care is an underinvested part of the healthcare system. Salaries and reimbursement rates are lower than specialty care, constraining physician supply. Many incumbent software tools for primary care are not cloud hosted or API-enabled, with poor user experience. Elation addresses these inefficiencies, unlocking improvements to physician work experience, reducing stress and burnout and improving quality and efficiency of care.
Impact Insights
-
What. During 2022, Generation supported the company’s second beneficiary survey, finding that 35% of Elation users reported lower levels of stress and burnout. Although the impact on providers’ ability to deliver patient-centred care was not reported in 2021, we note that 30% reported decreased administrative time vs. 36% in 2021.13
-
How. In 2022 Generation co-led an additional funding round allowing Elation to continue to drive the healthcare industry’s technology-led transition to VBC. We supported the company with its first acquisition, of Lightning MD, a billing software provider. Elation’s voluntary turnover and carbon footprint also decreased significantly year-on-year, demonstrating strong human capital management and resource-efficient growth.
Investment Detail
Year Invested
2020
Guideline

What it does?
Guideline is a comprehensive, low-cost retirement platform for small and medium-sized businesses (SMBs) across the US. The company has built an in-house technology solution that automates record keeping and administration and allows employers to seamlessly onboard employees (through auto-enrolment) while ensuring retirement plan and regulatory compliance.
System Positive Thesis & Solution
In the year before Generation’s investment in Guideline, there were 5.8 million small businesses in the US; only 10% offered a 401(k) plan to their employees, and when they did, historic participation was around 52%.14 Incumbent 401(k) providers struggled to adequately extend services to small companies, leaving this segment with few options. Guideline’s focus on small businesses helps close the retirement savings gap by driving 401(k) penetration in SMBs.
Impact Insights
-
What. As of 2022, Guideline served over 37,000 small businesses15, a figure that has continued to increase with continued revenue growth, and today Guideline has over USD 7 billion invested for retirement on their platform.16 In 2022, Generation supported Guideline with its second beneficiary survey after a prior survey in 2020. In 2022, 79% of respondents reported they were better able to save for retirement due to Guideline, a step up from 71% in 202017.
-
How: In 2022, Guideline launched SEP IRA (Simplified Employee Pension) as an additional option for self-employed individuals and other small business owners, helping to further support financial inclusion.
Investment Detail
Year Invested
2020
Gusto

What it Does
Gusto is a software platform designed to automate and simplify payroll, HR and benefits for micro, small and medium-sized business (SMBs).
System Positive Thesis & Solution
Between 2009 and 2018, ahead of Generation’s investment in Gusto, workers in the bottom tenth percentile of wages saw benefits fall by around 2% in real terms.18 This is particularly poignant for small businesses, employing over half the US’s private sector workforce. Many payroll and benefits products, which play a critical role in economic inclusion for SMB workers, are designed for larger organisations and not fit for purpose. Gusto is a key intermediary, providing more bargaining power to SMBs, enabling workers to get better rates on health insurance and benefits. Ultimately, Gusto can increase take-home income for populations that are traditionally underserved.
Impact Insights
-
What. From 2021 to 2022, the number of small businesses Gusto served has increased about 50%19. Gusto has been ranked as the top payroll software by both Nerdwallet and U.S.News in early 202320. In 2022, 94% of those businesses reported a better ability to scale their growth due to Gusto.21
-
How. In 2022, Gusto published its second RISE (Representation, Inclusion, Social Impact and Equity) report, emphasising their focus on hiring, progression, retention and engagement.
Investment Detail
Year Invested
2019
Nature's Fynd
What it does?
Nature’s Fynd is a Chicago-based food tech company creating versatile alternative proteins to nourish the world’s growing population while nurturing the planet. Born out of research conducted for NASA on microbes in Yellowstone National Park, the company’s breakthrough technology produces Fy Protein. Nature’s Fynd uses Fy to make nutritious and sustainable meat and dairy alternatives.
System Positive Thesis & Solution
The food supply chain is responsible for 26% of global GHG emissions. Agriculture also causes 80% of land-use change and habitat destruction, and is responsible for two thirds of freshwater withdrawals, driving 90-95% of global, scarcity-weighted water use.22 Nature’s Fynd produces a highly nutritious complete protein using only a fraction of the resources required by traditional agriculture and with minimal processing, to help efficiently feed a growing global population in a net-zero world.
Impact Insights
-
What. Following the launch of Nature’s Fynd’s meatless breakfast sausage and dairy-free cream cheese in 2021, Nature’s Fynd expanded nationally to retail stores across the United States. In parallel, Generation supported a more in depth impact analysis, quantifying carbon and land-use savings at scale.
-
How. Nature’s Fynd continued to foster sustainable food systems, helping found the Fungi Protein Association and supporting the Menus of Change University Research Collaborative. Nature’s Fynd was also a finalist in Fast Company’s World Changing Ideas Awards. Finally, Generation supported the search and approval for the newest female Board Director.
Investment Detail
Year Invested
2020
o9
What it Does
o9 Solutions is a cloud-based supply chain planning platform that enables enterprises to optimise their supply chains by providing supply planning, demand forecasting, commercial planning, retail planning and other related software modules. o9 was founded in 2009 by pioneers who identified the need for a cloud-native, extensible platform capable of providing real-time end-to-end planning solutions.
System Positive Thesis & Solution
o9 is an emerging leader in the Supply Chain Planning market with its cloud-based, highly configurable platform that enables real time, holistic and flexible supply chain planning. According to the US EPA, supply chains can often account for over 90% of emissions related to a business.24 o9 gives companies greater insight into their operations, particularly through inventory management, product waste and transport, allowing for reductions in resource intensity and supply chain (Scope 3) emissions. o9’s solution is differentiated due to its modern tech stack and its ability to incorporate broader areas of its customers’ organisations, such as finance and sales/marketing, into supply chain planning.
Impact Insights
-
What. o9 is in the early stages of impact measurement. Generation is currently working with o9’s other investors to support o9’s efforts to quantify emission reductions and use that information to best position o9 Solutions in the market to demonstrate resource efficiency.25
-
How. In April 2022, Generation was proud to give the keynote address at the o9 client conference, and continues to engage with leadership on product development. In June 2022, o9 published its first ESG report, highlighting its role in driving sustainability for clients.
Investment Detail
Year Invested
2022
Pivot Bio

What it Does
Pivot Bio has unique and defensible intellectual property related to biological nitrogen fixation pathways and has developed a family of naturally-occurring microbes which convert (“fix”) atmospheric nitrogen into plant-usable nitrogen allowing for the improved operational efficiency for growers and a lower environmental impact for all.
System Positive Thesis & Solution
The production and use of synthetic nitrogen fertiliser accounts for over 2% of global greenhouse gas emissions.29 Almost half of synthetic nitrogen fertiliser also leaches into groundwater, causing significant environmental damage.30 Pivot Bio provides a more reliable and consistent method for delivering plant nutrition, while avoiding environmental damage. As just one example, on a typical 1,500 acre Iowa corn farm, Replacing 40lbs/acre of synthetic nitrogen fertilizer with Pivot Bio would supply 27.21 metric tons of nitrogen from Pivot Bio microbes, and avoid 260 metric tons of CO2e emissions.31 Further, the microbes are naturally-occurring (though genetically edited) and do not destroy the soil microbiome, preserving its nutritional richness and staving off depletion.
Impact Insights
-
What. Pivot Bio conducted their own environmental impact assessment in 2022, building off the LCA Generation supported last year. Between 2021 and 2022, Pivot Bio’s operations resulted in increases of 74% of saved emissions (tCO2e).32
-
How. In 2022, Generation supported the hiring of Jane Franch, Senior Director of ESG, who has previously worked in strategic sourcing to help lead data collection. This builds on Generation’s previous efforts to build a strong leadership team and diverse board, with a 2021 Board search resulting in two new diverse Board members who joined in 2022: Monica McGurk, formerly with Kellogg’s, and Susan Kim, CFO of Pacific Biosciences.
Investment Detail
Year Invested
2021
project44
What it Does
project44 is a supply chain visibility platform selling to shippers and logistics service providers. It uses an API-led approach to connect carriers to shippers and provide real-time data of where products are in transit across all transportation modes in North America + Europe. Historically, shippers would have to create and maintain point-to-point electronic connections with their carriers in order to be able to communicate electronically. project44’s approach offers real-time visibility in a plug-and play approach, allowing everyone to have real-time visibility into their goods.
System Positive Thesis & Solution
COVID-19 and recent supply chain disruptions have shown the value of real time visibility in supply chain management. Modern API-based technology has now made this affordable and possible on a global, multi-modal basis. project44 is has accelerated ahead of its competition through 1) an API-led approach, 2) focus on integrating with carriers, and 3) taking full responsibility for network compliance. Additionally, project44 will be able to add additional analytics and value-add products on top of their real-time visibility platform. Real-time data is an important element to driving efficiencies across the supply chain, as customers are able to better plan their operations (less waste = lower cost), avoiding carbon emissions and lowering their resource use.
Impact Insights
-
What. After joining the portfolio in 2022, Generation is pleased to have spearheaded project44’s first LCA focused on emissions and pollution avoidance, demonstrating that project44’s services avoided 59,000 tCO2e in the year.29 project44 is also working to launch a carbon tracking module and continues to highlight the sustainability angle of their product offerings.
-
How. Generation is supporting project44’s ESG data measurement and benchmarking efforts to increase the ability to meaningfully report on their progress and actions.
Investment Detail
Year Invested
2022
Vestiaire Collective

What it Does
Vestiaire Collective is a global online marketplace for pre-owned luxury fashion, with millions of members in over 80 countries. Close to 25,000 items are added daily across fashion categories. The company was founded to promote circularity in the fashion industry to make it more sustainable and to broaden access to high quality goods.
System Positive Thesis & Solution
In 2021, the fashion industry and its supply chain was the world’s third largest polluter, producing 5% of the world’s GHG emissions.30 Encouraging circularity by reselling fashion goods extends their life, reduces waste and reduces fashion goods’ carbon footprint, contributing to reducing the footprint of the fashion industry as a whole. Vestiaire Collective plays a critical role in facilitating this shift to a more sustainable fashion industry worldwide.
Impact Insights
-
What. Generation again supported Vestiaire Collective in conducting an LCA. From 2021 to 2022, emissions avoided and water savings attributable to Vestiaire increased by 27%.31 In total, shopping with Vestiaire Collective saves 90% of the environmental cost of a new item, and 70% of customers report that shopping on the site prevents them from buying a new item32.
-
How. In April 2022, Generation made a follow-on investment in Vestiaire Collective to support their acquisition of Tradesy, as US competitor. In December 2022, Generation’s Chairman, Al Gore, spoke in a fireside chat with Stella McCartney on the circular economy, helping to build Vestaire’s brand awareness among sustainability-minded influencers and consumers.
Investment Detail
Year Invested
2021
In Focus: Equity, Diversity, and Inclusion (EDI)
Context
Sitting at the overlap of our three impact domains, planetary health, people health and financial inclusion, is EDI. A well-represented employee base will allow for more dynamic and thoughtful organisation that fosters collaboration and innovation. Following our update last year to include a workforce gender diversity non-binary category, we continue to evaluate the way we collect and present diversity data. This year, we have re-named our ethnic diversity category as ‘Percentage identifying as an underrepresented racial and ethnic group’ (“UREG”). We believe this change is more inclusive, as it allows for a less US/UK-centric lens on evaluating the performance of our portfolio companies. This year, we have taken our commitment further by participating in voluntary benchmark reporting, including to one of our EDI-centred Limited Partners, and by aligning certain metrics to those used by the ESG Data Convergence Initiative (EDCI), to help create comparable performance data for the industry.
Engagement
In continuation of our commitment to enriching diversity and inclusion within our team, portfolio, and the broader investing community, in 2022 the Growth Equity team introduced a comprehensive EDI strategy that focuses on the following areas, comprising not just portfolio engagement but EDI for the team itself. In 2022, the Growth Equity team, along with Generation more broadly, also formalized a partnership with Sponsors for Educational Opportunity (SEO) focused on recruiting talent from their alternative assets program. Additionally, for the first time Generation initiated a new a relationship with an EDI-centered Limited Partner focused on bias reduction. Lastly, the Growth Equity team continued our partnership with Impact Capital Managers’ MOSAIC Fellowship for high achieving MBA students from underrepresented backgrounds, hosting an intern for the second summer in a row.
Sources: Percentage Female & Non-Binary14, Percentage UREG15
Definitions: Management16, Technical Staff17, Other Staff18
Insights
In 2022, 14 companies reported gender diversity of management and technical staff and 13 reported diversity of other staff, across 15 companies. Ten companies reported ethnic diversity results at the management level and nine reported at the technical and other staff level, with certain companies prevented from disclosing due to national regulation. We continue to note relatively higher gender diversity across the ‘other staff’ category, but have seen dips in gender and ethnic diversity across remaining staff segments. The steepest decline in gender diversity has been in management teams, with new portfolio entrants’ relatively lower diversity reducing the total average, and five companies reporting decreases on a like for like basis. Like for like decreases may be an unintended impact of 2022 workforce restructurings and is a focus area for us as we seek to support our companies in the coming year.
Example initiatives within the portfolio
In 2022, we saw one company nominate a Diversity, Equity, and Inclusion Senior Lead to create and steer a three year diversity strategy. The same company has implemented a new EDI training course for all employees and maintained three employee resource groups focusing on cultivating safe and supportive spaces for female-identifying employees, LGBTQIA+ employees and allies as well as Black, Indigenous and people of colour (BIPOC) and allies. It is encouraging to see some of our portfolio companies set their own workforce diversity targets, confirming value alignment. We are pleased to see many companies have kept diversity and inclusion training as offerings to all employees. Finally, we noted a general increase to the learning offerings of companies across all staff levels, highlighting the desire to provide development opportunities to all, regardless of employment level.
In Focus: Environmental Impact
Context
It is critical for our portfolio companies to measure and improve their positive climate impact, regardless of whether their business is tackling outcomes in Financial Inclusion, People Health or Planetary Health. Understanding our portfolio’s total GHG footprint is also an essential first step to achieving our firm-wide commitment to align our portfolio to net zero by 2040. Conducting year over year assessments for those companies that have been in the portfolio for more than one year has allowed us to see operational hot spots and areas that are ripe for emission reduction initiatives.
Engagement
For the third year, we focused our engagement on driving ‘carbon-consciousness’ by supporting and encouraging a comprehensive evaluation of Scope 1-3 GHG emissions for each company in SSF III. We supported the completion of carbon inventories for 11 of our 15 companies in 2022, with three others using their own providers and one declining to participate. In addition, in early 2023 we increased our focus on SBTs, conducting a portfolio analysis to identify the highest-potential companies on which to focus our engagement.
Scope Breakdown (Aggregate Portfolio)
Insights
Across 15 companies, the portfolio as a whole emitted over 634k tCO2e in 2022. We continue to work with our companies on data quality, and are still completing the picture – which contributed to substantive year on year change. As just one example, our digital freight marketplace company, Convoy, broadened their 2022 Scope 3 emissions to include the footprint of their leasing model. This was a progressive step to include holistic Scope 3 data, but went beyond what we included in the past, and resulted in emissions that now represent over 97% of Convoy’s total carbon footprint and over 55% of the entire portfolio’s 2022 emissions. Six companies’ emissions also increased due to new facilities openings. These examples highlight the difficulties of analysing portfolio data in a growing portfolio, with variability in reported Scope 3 categories and annual improvements in data quality, and showcases the importance of getting comparability in reporting scope in future years.
As of the end of 2022, four companies have set Science-Based Targets (o9, Vestiaire, Convoy, Back Market), with one of those targets verified (Back Market). In line with our firm-wide commitment to increase the coverage of Science-Based Targets throughout the portfolio, this is an area of focus moving forward.
In Focus: Engagement
Context
To help guide our interactions with our portfolio companies, we orient our value-added engagement in four strategic areas: board, product and commercial, governance, and capital markets. Across all areas, impact is a unique source of insight and value.
Definitions and example activities are outlined in the table below.
Impact integrated as a unique source of value across all areas |
||||
Board |
Product & Commercial |
Governance, People and Operations |
Capital Markets |
|
| Growth Equity Insight |
The value of Board independence and diversity |
The value of product impact in driving growth |
The value of good governance for the long-term |
The value of impact at exit |
| Example Engagement Activities |
|
|
|
|
Historical Engagements
This year, we conducted a comprehensive review to establish our history of value-add through engagements with our SSF III (and wider Growth) portfolio on Board and Product & Commercial levers since 2020 through to 2022. In line with precedent in the listed equity markets and for our Global Equity strategy, we consider engagements to be those interactions with our companies – separate to normal monitoring activities – in direct contemplation of the company achieving a specific outcome. A list of validated engagements with our SSF III companies on Board, Product, and Commercial, as a starting point, is shown in the table below.
Board |
Product |
Commercial |
Total portfolio companies |
% Companies engaged with |
|
| 2020 | 1 | 5 | 2 | 8 | 75% |
| 2021 | 10 | 9 | 3 | 13 | 85% |
| 2022 | 3 | 11 | 4 | 15 | 80% |
We have been conservative in listing only engagements ‘validated’ through evidence we’ve collected.
Insights
The concentration of our efforts has been in helping our companies measure and communicate product impact, supporting the search and selection of diverse and/or independent Board members, and lastly using our convening power to help companies build brand awareness and generate prospects. Over the course of 2022 to Q1 2023 we have made significant enhancements to our platform to support effective engagement, including three new hires with a partial value-add focus. Comprehensively monitoring our engagements and using this insight to help our team better prioritise engagement efforts on the areas likely to drive both positive impact and financial results, is a priority for the coming year.
Data Partners for this Report
Click on the logos below to read more about the data partners for this report.
60 Decibels
60 Decibels is an end-to-end impact measurement company. Their aim is to make it easy to listen to the people who matter most, measuring impact from the ground up.
Using their Lean Data approach, 60 Decibels speaks directly to customers, employees or beneficiaries, quickly returning high quality data to help customers maximise their impact and grow their business. They have 1,000 researchers conduct local-language voice surveys in 70 countries, who use tested social impact survey tools, aligned to industry standards, and have worked across a variety of industries including agriculture, education, financial inclusion and supply chains.
Data presented for calendar years is conducted as close to year-end as possible and is the most readily available information.
Environmental Capital Group
Environmental Capital Group (ECG) advises investors and companies on impact and ESG issues, with deep expertise in quantitative Life cycle Assessment (LCA) of carbon, energy, pollution and resources across investment portfolios. Starting in 2007, ECG served as an environmental advisor to CalPERS’ Clean Energy and Technology Program, developing one of the largest programmes of sustainability impact accounting and reporting in the world. Cliff Brown, Managing Director of ECG, has led this work for 14+ years, advising investors and companies on strategy and sustainability, including ESG issues.
Cliff has prepared the ESG assessment of our portfolio companies in accordance with best practices for ESG accounting and reporting. For the 2022 year, ECG performed the impact analysis for Back Market, Convoy, Nature’s Fynd, Pivot Bio, project44 and Vestiaire Collective, including the lifecycle assessments compared to business-as-usual.
Emitwise
Emitwise’s AI technology empowers companies to automatically measure, report and reduce their carbon footprint across their operations and supply chain, future-proofing businesses for a net-zero carbon world. Based in London, Emitwise is a software solution enabling companies to automate their carbon accounting across business units and suppliers, liberating them from the burden of collecting and processing emissions data. The platform utilises artificial intelligence to precisely measure or estimate emissions in real-time, enabling businesses to identify and tackle carbon hotspots and devise a trackable roadmap to net-zero carbon. Used by companies internationally and across various sectors, the platform aligns businesses with global climate targets and reporting standards, helping them mitigate risks and accelerate their transition to net zero.
In 2021, Emitwise has calculated greenhouse gas emissions inventories for all private companies in Generation’s portfolio, as well as Remitly. In 2022, Emitwise calculated greenhouse gas emission inventories for 10/13 private companies in the portfolio, as well as Remitly.
Glossary of terms
|
Terms |
Definitions |
|
API |
Application programming interface |
|
Board gender diversity |
Share of Board members self-defined as identifying as female and non-binary as of period end. |
|
Board independence |
Non-executive board members defined as share of members of the Board who are not employed by the Company as of period end. |
|
BQ |
Business Quality |
|
CDP |
Carbon Disclosure Project |
|
CO2 |
Carbon dioxide |
|
Carbon intensity |
Aggregate tonnes of carbon dioxide (CO2 equivalent) per USD M revenue (not restricted to CO2, includes a basket of emissions). Intensity for prior years based on conversion to USD M based on May 2022 FX rates. |
|
CSR |
Corporate Social Responsibility |
|
EDI |
Equity, Diversity and Inclusion |
|
ESG |
Environmental, Social, Governance |
|
GHG |
Greenhouse Gas |
|
GIM |
Generation Investment Management |
|
IFRS |
International Financial Reporting Standards |
|
IGPCC |
Intergovernmental Panel on Climate Change |
|
Impact domain |
Organised into the categories of i) Planetary health ii) People health and iii) Financial inclusion, Impact domains to allow us to communicate the social and environmental outcome domains to which our portfolio companies contribute. |
|
IMP |
Impact Management Project |
|
IP |
Intellectual property |
|
ISSB |
International Sustainability Standards Board |
|
Jobs provided |
Employee count (FTE) as of period end. FTE is calculated by taking into account the number of hours worked in a full-time weekly schedule and the actual number of hours employees work. |
|
KPI |
Key Performance Indicator: Impact as defined through GIM’s system positive analysis of the Portfolio Company. Metrics have been individually defined for each Portfolio Company to capture the contribution of the company’s product or service on the Sustainability objective, as well as overall Impact domain. |
|
LCA |
Life Cycle Assessment |
|
Management |
The following was provided to Portfolio Companies during data collection: As outlined in SASB E commerce sector guidance, which can be applied across industries for this topic, management includes executive/ senior level officials and managers as well as non-executive first/mid level officials and managers. For non-U.S. employees, the entity shall categorize the employees in a manner generally consistent with the definitions provided above, though in accordance with, and further facilitated by, any applicable local regulations, guidance, or generally accepted definitions. |
|
MQ |
Management Quality |
|
NASA |
National Aeronautics and Space Administration |
|
NED |
Non-Executive Director |
|
Other Staff |
The following was provided to Portfolio Companies during data collection: All other employees includes those employees who are not classified as management or technical staff. For non-U.S. employees, the entity shall categorize the employees in a manner generally consistent with the definitions provided above, though in accordance with, and further facilitated by, any applicable local regulations, guidance, or generally accepted definitions. |
|
SASB |
Sustainability Accounting Standards Board |
|
SBT |
Science-based target |
|
SDG |
Sustainable Development Goal |
|
SMB |
Small and Medium-sized businesses |
|
TCFD |
Task Force on Climate-related Financial Disclosures |
|
tCO2e |
tonnes of carbon dioxide equivalent |
|
Technical Staff |
The following was provided to Portfolio Companies during data collection: As outlined in SASB E commerce sector guidance, which can be applied across industries for this topic, Technical staff includes employees categorized in the 15-0000 group (Computer and Mathematical Occupations) or 17-0000 group (Architecture and Engineering Occupations) of the U.S. Bureau of Labor Statistics' 2018 Standard Occupational Classification System. For non-U.S. employees, the entity shall categorize the employees in a manner generally consistent with the definitions provided above, though in accordance with, and further facilitated by, any applicable local regulations, guidance, or generally accepted definitions. |
|
UN PRI |
United Nations Principles for Responsible Investment |
|
UNEP FI |
United Nations Environment Programme Finance Initiative |
|
UREG |
People self-identified as belonging to an under-represented group (i.e. belonging to an ethnic minority within a given country’s context). Note, GIM has previously used "POC" in the position of UREG. |
|
Voluntary turnover |
Turnover is defined as the number of FTEs (Full Time Equivalents) leaving the business, excluding those from M&A, over the course of the reporting period divided by the average number of FTEs in the previous year multiplied by 100 |
Disclosure Frameworks
Generation believes in the principle of integrated reporting on financial and sustainability activities, performance outcomes and risks. In certain cases, we also publish supplementary reporting to ensure our reporting meets specific regulatory or voluntary commitment requirements. A summary and links to these disclosures is below.
|
Task Force for Climate-related |
Generation has made a commitment to use the TCFD’s recommended framework for disclosing its climate-related exposure each year. Our most recent TCFD report, covering 2021, was published in 2022. |
|
|
Sustainable Finance Disclosure |
Generation adheres to the European regulatory framework SFDR and discloses its sustainability risks, remuneration, consideration of Principal Adverse Impacts (PAIs) and the classification of its funds, in its fund offering documents and/or on its website, according to SFDR’s required practices. |
|
|
UK Stewardship Code |
Generation is pleased to have been accepted by the Financial Reporting Council as one of the initial signatories to the UK Stewardship Code last year. Generation’s Stewardship Report has just been submitted and is available publicly on our website under Our Strategies. |
Key Frameworks
|
|
|
|
|
 |
|
 |
|
Read the report in full
Download- We have been investing for 16 years as a Growth Equity team – beginning with our research ahead of the final close and launch of our first Sustainable Solutions Fund in 2008.
- Growth Equity team as at 31 December 2022, excluding individuals who are not 100% allocated to the Growth Equity team and long-term consultants.
- AlayaCare Investor Presentation, (AlayaCare, Mar. 2021).
- Data on impact over time comes from a survey of a sample of AlayaCare’s care workers conducted by 60 Decibels. For more information on the survey and 60 Decibels, please see Data Providers for this Report.
- Data on impact over time comes from Andela itself (talent matched to positions), and a survey of a sample of Andela’s programme participants conducted by 60 Decibels. For more information on the survey and 60 Decibels, please see Data Providers for this Report. Further note, 2022 Developers trained is an estimate provided by Andela in December 2022 defined as 'learners enrolled in [Andela's] learning programs.
- Back Market CEO: “We want to make buying refurbished products cool” (Management Today).
- Data on impact over time comes from Back Market’s LCA conducted by ECG. For more information on ECG, please see Data Providers for this Report.
- Data on impact over time comes from Benevity itself (unique changemakers) and a survey of a sample of Benevity’s enterprise clients and, separately, charitable causes, conducted by 60 Decibels. For more information on the survey and 60 Decibels, please see Data Providers for this Report.
- Environmental Capital Group, 2021.
- “Fast Facts: U.S. Transportation Sector GHG Emissions” (US EPA, 2019), Convoy data and estimates, ECG analysis. Data refers to truck freight within the US only — it does not include international transport or rail and shipping freight.
- Data on impact over time comes from Convoy’s LCA conducted by ECG. Convoy’s carbon savings are calculated for “batched” shipments, when carriers are connected to a nearby load, therefore reducing empty miles. For more information on ECG please see Data Providers for this Report
- Elation Health Has Quietly Built A Leading EHR In Primary Care. Will A Fresh $50 Million Fuel Its Expansion In The Enterprise Market? (forbes.com) (Forbes, July 2022).
- Data on impact over time comes from a survey of a sample of Elation Health’s health providers conducted by 60 Decibels. For more information on the survey and 60 Decibels, please see Data Providers for this Report.
- Small Business 401(k) Access Gap Exposed | Guideline (Guideline, Mar. 2019).
- Guideline | 2022 Year in Review (Guideline, Jan. 2023).
- Figure taken from Guideline’s website under the section ‘Guideline today’, (Guideline, Apr. 2023).
- Data on impact over time comes from a survey of Guideline participants conducted by 60 Decibels in 2020. As comprehensive data was collected, the survey was not re-run in 2021. For more information on the survey and 60 Decibels, please see Data Providers for this Report.
- U.S. Bureau of Labor Statistics.
- Calculated based on public information taken from the Gusto website. Figures are rounded.
- Awards displayed on Gusto’s website as of April 2023 and manually validated by Generation. Best Payroll Software 2023 | U.S. News (usnews.com) Best Payroll Software Services of April 2023 - NerdWallet
- Data on impact over time comes directly from Gusto’s website. Figure is from their August 2022 Tech Validate survey of 500+ customers. (Gusto, accessed Apr. 2023).
- Poore, J., & Nemecek, T. (2018). Reducing food’s environmental impacts through producers and consumers.
- Data on impact over time comes from Nature’s Fynd’s LCA conducted by ECG. For more information on ECG please see Data Providers for this Report.
- Supply Chain Guidance | US EPA (US, EPA, Accessed Apr. 2023).
- o9 Solutions was not in the Fund last year, but GIM obtained a carbon emission avoidance analysis for a single customer (displayed). For 2022, given the nature of each of o9 Solutions’ customers having different business models and emission reduction plans, a similar analysis has not been done. GIM is in talks with o9 Solutions’s consultants to carve out a path forward.
- New research shows 50 year binge on chemical fertilisers must end to address the climate crisis (Institute for Agriculture and Trade Policy, Nov. 2021).
- Review Nitrogen Fertilization. A Review of the Risks Associated with the Inefficiency of Its Use and Policy Responses (Martinez-Dalmau, Javier, et al., May 2021).
- Pivot Bio Impact Report 2022. (Pivot Bio, forthcoming 2023).
- 2022 Data on impact over time Pivot Bio calculated greenhouse gas emissions avoided through analysing "growers who validated their replacement through [Pivot Bio's] N-OVATOR program,[and] 49% of non-enrolled customers [who] reported reducing their standard synthetic nitrogen application due to adoption of Proven40"(Pivot Bio, forthcoming 2023). 2021 Data on impact over time comes from Pivot Bio’s LCA conducted by ECG. For more information on ECG please see Data Providers for this Report.
- Net-Zero Challenge: The supply chain opportunity (World Economic Forum, Jan. 2021).
- Data on impact over time comes from Vestiaire Collective’s LCA conducted by ECG. For more information on ECG please see Data Providers for this Report.
- Vestiaire Collective data shows positive eco impact of resale (fashionnetwork.com) (Fashion Network, Apr. 2022).
Important Information
The material contained in this document (the “Document”) has been prepared by Generation Investment Management LLP (“Generation”) for informational purposes only and reflects the views of Generation as at May 2023. It is not to be reproduced or copied or made available to others without the consent of Generation.
The Document is compiled in part from third party sources believed to be accurate, including the Fund’s investee companies themselves. Generation believes that such third party information is reliable, but does not guarantee its accuracy, timeliness, or completeness. It is subject to change without notice. The information should not be considered independent; it may be subject to error or omission and should not be relied upon.
Generation accepts no liability for loss arising from the use of this material. Any opinions expressed are our current opinions only. This Document is not meant as a general guide to investing. It is expressly not a source of any specific investment recommendations. It makes no implied or express recommendation concerning the manner in which any client's account should or would be handled. Under no circumstances is it to be considered as an offer to sell or a solicitation to buy any investment referred to in this Document. It is not investment research. Should you disregard this caution, you should further be aware that, in consequence, it does not take into account your individual circumstances nor your financial situation or needs. Securities can be volatile and entail risk and individual securities presented may not be suitable for you. You should not buy or sell a security without first consulting your financial advisor or considering whether it is appropriate for you and your respective portfolios.
Generation, its employees, partners, consultants, and/or their respective family members may directly or indirectly hold positions in the securities referenced.
Any statements of opinion or belief contained in this Document, all views expressed and all projections, forecasts or statements relating to expectations regarding future events or the possible future performance of any product in respect of which Generation or any affiliates provide management or advisory services (or any other product) are those of Generation and represent Generation's own assessment and interpretation of information available to it as at the date of this Document and are subject to change without notice. No representation or warranty is made, nor assurance given, that such statements, opinions, projections or forecasts are correct or that the objectives of Generation or any products in respect of which Generation or any of its affiliates provide management or advisory services (or any other products) will be achieved. No responsibility is accepted by Generation or any affiliates in respect thereof.
The Fund is a private and unregulated fund and is not registered for distribution to the public or for private placement in any jurisdiction. Specifically, the Fund is not and will not be registered under the Securities Act of 1933 or registered or qualified under any US state securities act. The Fund is not and will not be registered as an investment company under the Investment Company Act of 1940. No regulator has approved the units in the Fund or their distribution.
Nothing in this Document should be interpreted to state or imply that past results are an indication of future performance. There is no assurance that any securities included within this report will remain in the Fund portfolio.
This communication has been issued in the United Kingdom by Generation Investment Management LLP ("Generation IM"), which is authorised and regulated by the Financial Conduct Authority of the United Kingdom and is a limited liability partnership registered in England and Wales. Registered No: OC307600. ARBN: 116 045 526. It is not a financial promotion. Generation IM is the parent entity of Generation Investment Management US LLP ("Generation US"), an investment adviser registered with the United States Securities and Exchange Commission under the Investment Advisers Act of 1940. Registration as an investment adviser with the SEC does not imply a certain level of skill or training. Generation IM and Generation US may only transact business in any state, country, or province if they first are registered, or excluded or exempted from registration, under applicable laws of that state, country, or province. In particular, Generation IM does not conduct business in the United States and persons in the United States should engage with Generation US only. Generation IM and Generation US are collectively referred to above as “Generation”.
If you have any questions relating to this report, please contact Generation Client Service at Generation Investment Management LLP, 20 Air Street, London W1B 5AN. Email: clientservice@generationim.com Tel: + 44 (0) 207 534 4700.