 Felix Preston
Felix Preston
Felix Preston joined Generation Investment Management in 2019 and is Director of Sustainability Impact and Research. Previously, Felix worked as a deputy research director and senior research fellow at Chatham House (The Royal Institute of International Affairs), where he led the energy, environment and resources department’s work on innovation and disruptive change. Felix also worked at AEA Technology, the Environment Agency and Safe Neighbourhoods Unit.
Felix received a BSc in Environmental Science and Geography from the University of Sussex and an MSc in Environmental Technology – Energy Policy from Imperial College London.


In brief
- Listed companies are responsible for 40% of climate-warming emissions
- This underscores the critical role that investors in listed equities must play in climate action, including through engagement and capital allocation choices
- Cutting emissions along the value chain must be a priority for both companies and investors
- As we approach COP26, mobilising action across the listed company landscape will play a crucial role in closing the ambition gap to 2030
Introduction
Listed companies are hiding in plain sight when it comes to the climate crisis. Far from being minor players, our analysis shows they are responsible for around 40% of all climate-warming emissions.
This is the first estimate of the overall extent of listed company greenhouse gas (GHG) emissions. Our calculation takes into account Scope 1, 2 and some types of Scope 3 emissions, while addressing double-counting. We believe it is a credible estimate. If anything, we expect further analysis to reveal that listed companies are responsible for an even greater share.
We have included a brief explainer on scopes later in this piece. In summary, ‘Scope 1’ covers direct emissions by a company – for instance, using fuels to heat a building or in an industrial process. ‘Scope 2’ is mostly purchases of electricity. ‘Scope 3’ covers all other indirect emissions: such as the energy used by a supplier, the use of equipment by customers or the transportation of goods by a third party.
The results highlight the critical role of investors in listed equities in climate action, via the impact of our capital allocation choices and our collective opportunities for engagement. Listed companies provide important entry points for accountability that are not available where companies are privately owned or under state ownership. The small number of investment managers appearing regularly in the top 10 shareholders of listed companies have an immediate responsibility to act.
Given their outsized resources and focus on developed markets, listed companies will need to deliver the lion’s share of private sector emissions reductions and get the world on track to halve emissions by 2030. The ambition for public companies as a whole should be net zero by 2040 at the latest, driven first and foremost by decarbonisation.1 The good news is listed companies have the capacity to be early movers. They are well-resourced and effective at managing change in short periods of time.
As we approach the crucial COP26 climate summit, our findings should give further impetus to investor and company action on climate change. They are also of relevance to regulators, many of which are currently developing finance sector frameworks to align with national net zero commitments.
We begin by setting out three key findings. We then set out the methodology and some of the key assumptions. We conclude by highlighting the implications for COP26 and beyond.
Key findings
1. Listed companies are responsible for 40% of global GHG emissions
Our estimate ranges from 22.0 to 23.1 GtCO2e per year. At the higher bound, this represents over 40% (40.2%) of global GHG emissions at 57.4 GtCO2e.2 At the lower bound, it is 38.3%.
For Scope 1, we use CDP data and remove non-listed companies.3 Our analysis then builds on this to incorporate additional Scope 2 and some Scope 3 emissions. We display the distribution of the emissions by major category in the chart below. The chart shows our higher-bound estimates (see Appendix 2 for details).
Figure 1: Listed Company GHG emissions
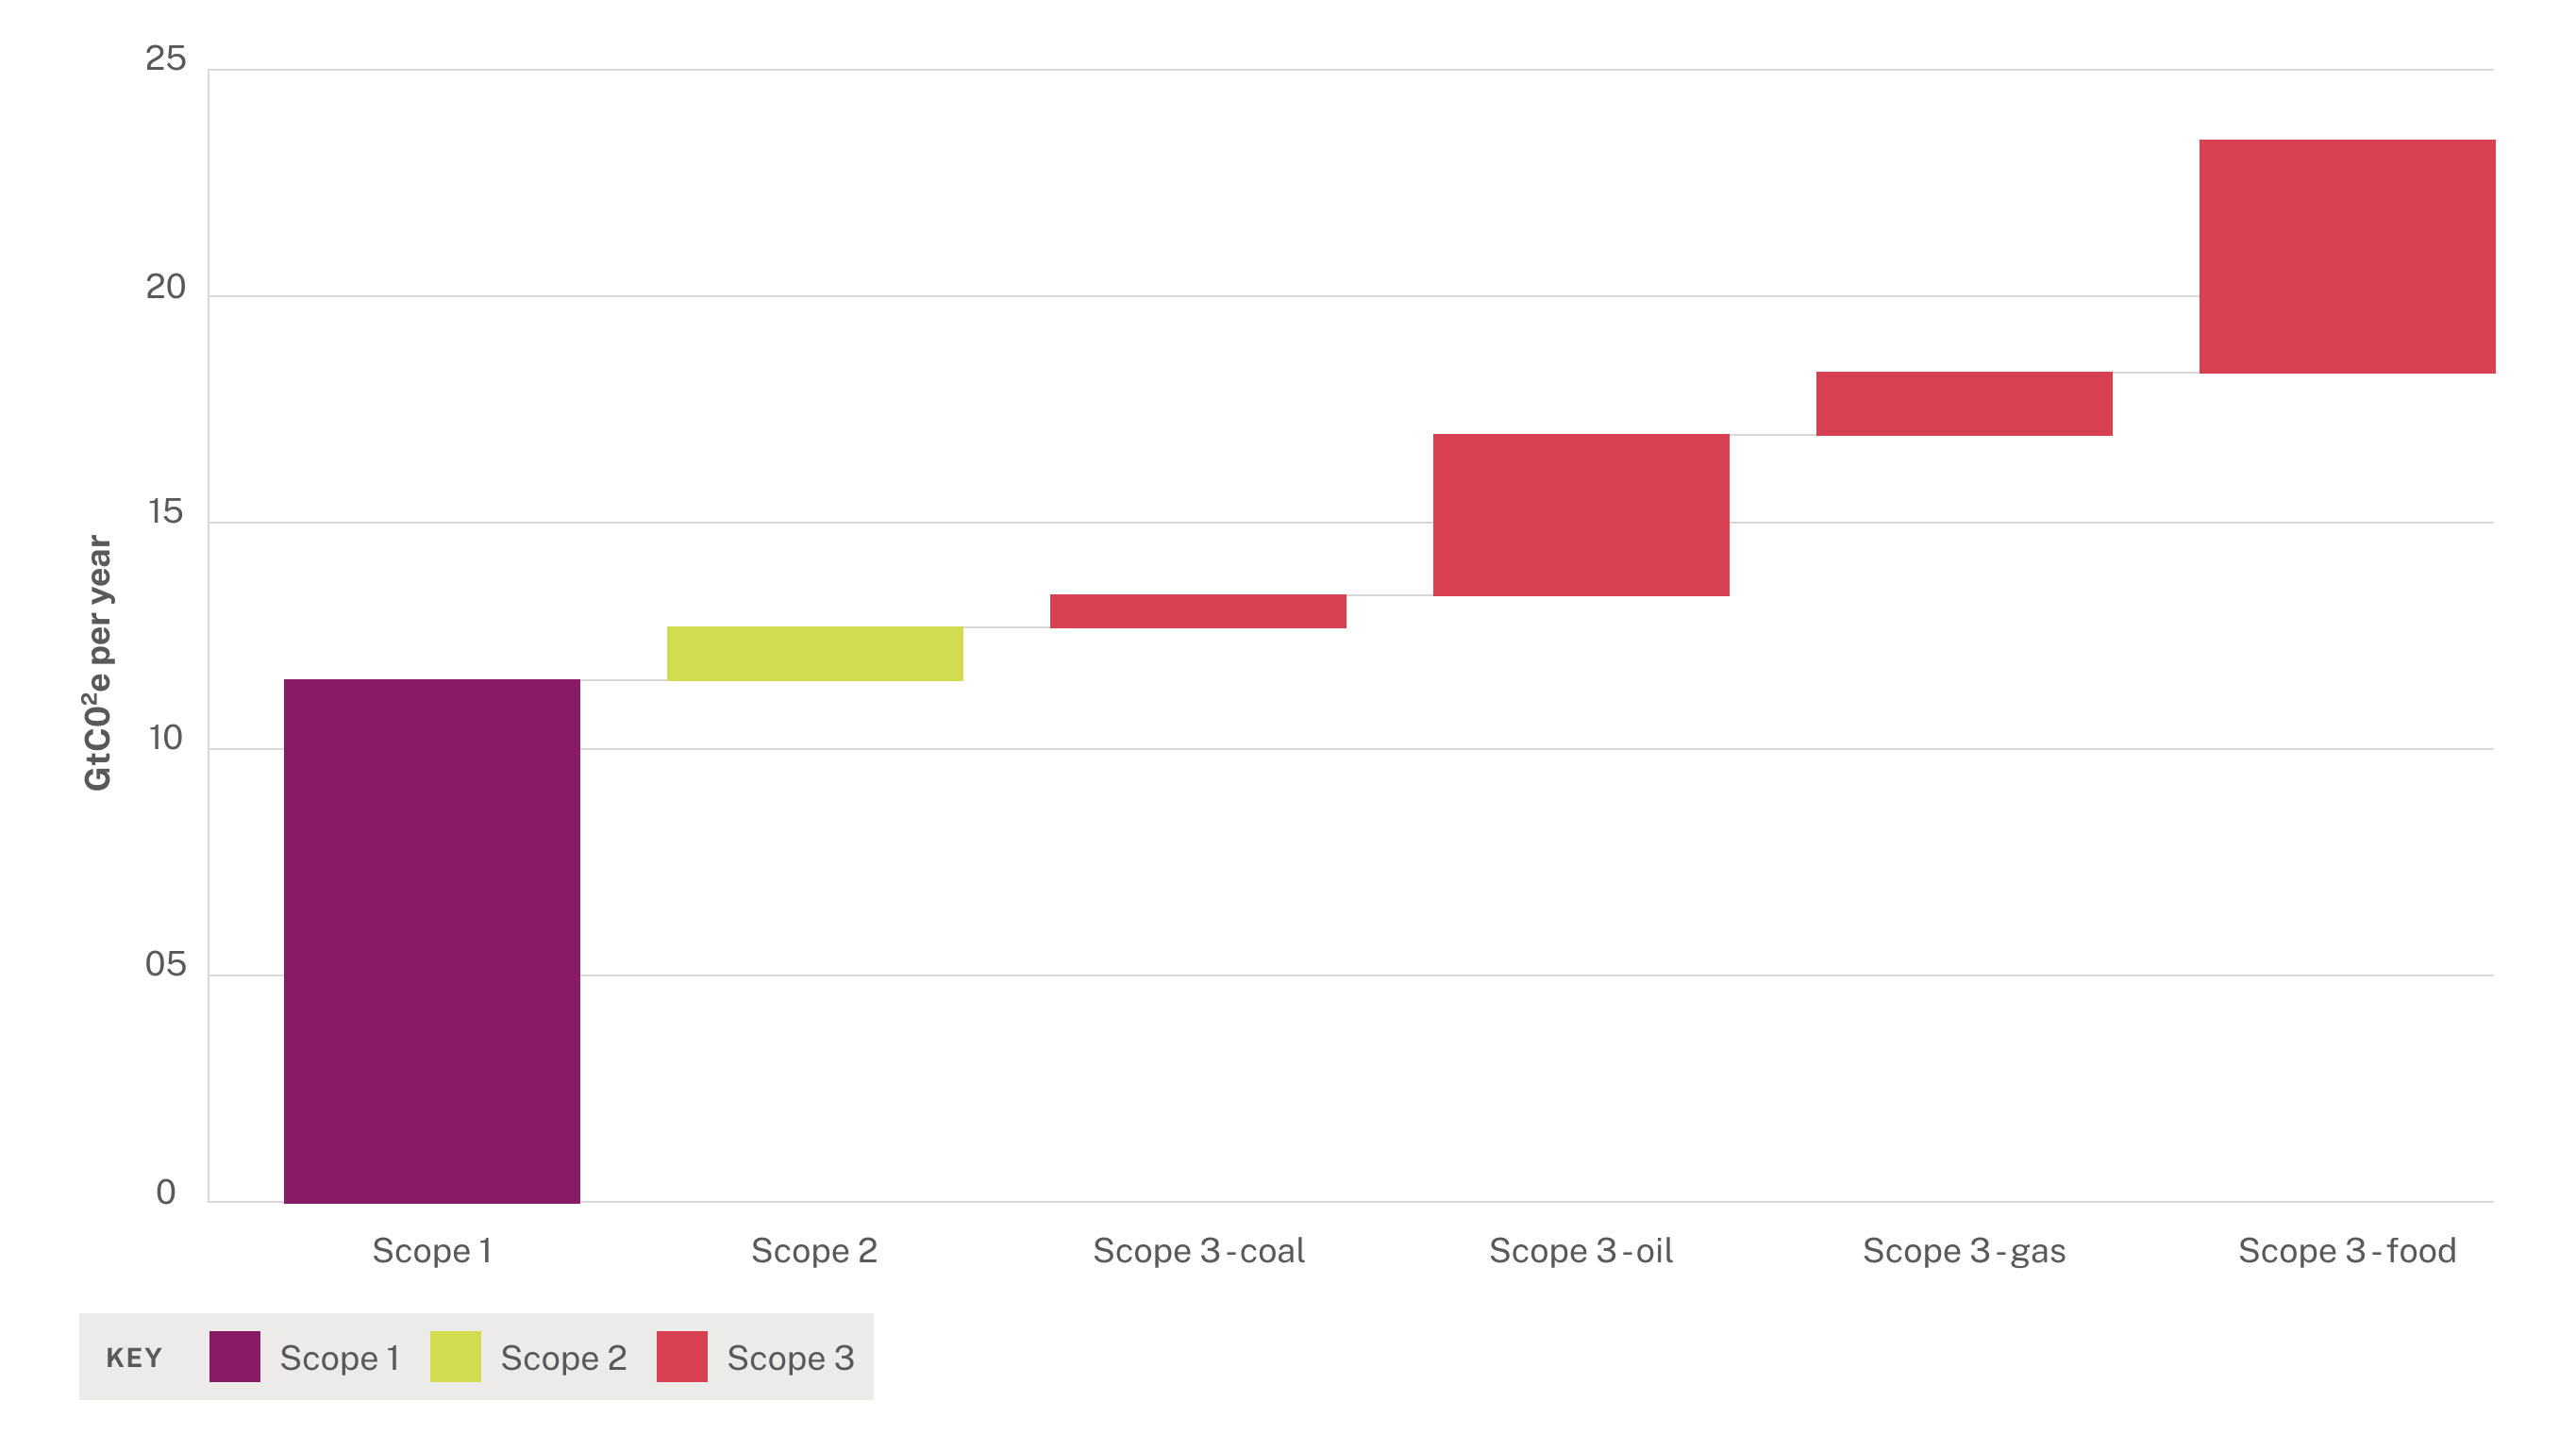
The chart shows the Scope 2 and 3 emissions that are ‘incremental’ to the estimate of listed company Scope 1 emissions. These are the Scope 2 and Scope 3 emissions that we believe can be attributed to listed companies without the risk of double counting. For instance, it should not be taken to mean that listed companies play a minor role in coal-related emissions. For listed electricity producers, these would fall under Scope 1.4
2. Value chains play a key role.
We have assessed GHG emissions in listed company value chains. This leads to an estimate that is almost double our Scope 1-only calculation, based on CDP data. Similarly, it is double the Scope 1-only calculation published recently by MSCI.5 Other published estimates, based on Scope 1, also lie in the range 15-20%.6
This confirms that cutting GHG along the value chain must be a priority for companies and for engagement by investors. CDP calculates that supply chain emissions are typically 5.5 times larger than a company's direct operations.7
Two critical areas are highlighted in the chart above. The first is oil. We include oil produced by listed global oil majors that is consumed by non-listed entities, such as households and small and medium-sized enterprises (SMEs). We also add the oil consumed in vehicles manufactured by listed companies, so long as it is produced by non-listed companies.
The second is emissions from food production and changes in land use (due, for instance, to the conversion of forests for agricultural use8). These are largely absent from Scope 1 estimates, because most food is produced by smallholder farmers (about one third of the total)9, by larger independent farmers and cooperatives, or by privately owned companies.
The methodology for each of these cases is discussed in the next section.
3. Public ownership comes with opportunities to engage
The corporate governance structures of listed companies provide important opportunities for accountability, whether to governments, investors or via media scrutiny.
Private companies retain significant control over their governance arrangements and are allowed to publish relatively few details about their business, including on critical sustainability issues. There are limited options available for external stakeholders to influence their climate transition strategies.
In contrast, public ownership comes with stronger rules around the disclosure of information and mechanisms for shareholders to vote for and against management decisions. Every day, investors trade trillions of dollars in listed companies, either directly or indirectly, via, for instance, stock exchange indexes.
What gets counted here really matters. For instance, Carbon Tracker recently found that many major emitters are failing to account for climate-related risks in their financial statements.10 In addition, the vast majority of climate commitments – such as ‘net zero’ emissions goals and ‘Science-Based Targets’ – are made by listed companies. It is crucial that these commitments are rigorously assessed and tracked.
Generation is committed to align our investment portfolios with net zero emissions by 2040. This includes material Scope 3 emissions, but the available data is currently of very poor quality. Squaring this circle ultimately requires much better and more consistent disclosure. Tools which can assess and verify emissions independent of corporate GHG disclosure, such as the newly-launched Climate TRACE, will also play a critical role.11 But we can't afford to wait for perfect data before cutting emissions.
As our results confirm, investors in public equities have a clear and urgent responsibility to push companies to act in line with a 1.5 degrees pathway. At Generation, we hope to persuade, but we will escalate our responses when companies fail to act – up to and including voting against management and, when needed, moving our clients’ capital elsewhere. Our fiduciary responsibility to our clients includes investing in companies that are helping to solve the climate crisis, not making it worse.
4. Investors should attack the problem from all sides
Investor action on climate change is targeted on the highest emitting and systemically important companies, in particular through the Climate Action 100+ initiative. Generation is a strong supporter of this initiative, and its importance is underscored by our findings.
At the same time, our analysis also suggests the collective importance of ten thousand listed companies globally has been underplayed.12 With the right incentives, these companies can attack emissions reduction from all angles and unleash untold potential for innovation and collaboration. Indeed, this could be an important weapon in driving change in incumbent heavy industries, which are some of the largest Scope 1 emitters. Many listed companies are more nimble and far less wedded to high-carbon business models than these incumbents.
Our approach
We combine several top down and bottom up calculations to give a clearer picture of listed company GHG emissions for the first time.
The multiple datasets used in the assessment are listed in Appendix 1, with links to sources. Among the most important are CDP’s reported and modelled dataset (2020 version) and sectoral data from the International Energy Agency and EDGAR-FOOD.
What’s new about our analysis of listed company GHG emissions is that it looks beyond the company boundary. The authoritative standard for emissions accounting, the ‘GHG Protocol’ has three scopes.
- ‘Scope 1’ are emissions that a company emits directly. For instance, this includes any fossil fuels burned for heating at company offices, or the vehicles that it directly owns or controls. It also includes emissions from coal and gas power plants.
- ‘Scope 2’ covers purchases of electricity, steam, heat, and cooling. I.e. emissions treated as Scope 1 for a power plant are seen as Scope 2 by a company consuming electricity.
- ‘Scope 3’ then covers all other emissions a company may be accountable for. These can be ‘upstream’ – relating to emissions from their suppliers, or their supplier’s suppliers. Or they can be ‘downstream’ – relating to the use of equipment by customers, for instance. Transport of goods also often appears in Scope 3. In total, there are fifteen categories of Scope 3 emissions, as you can see in the graphic below.
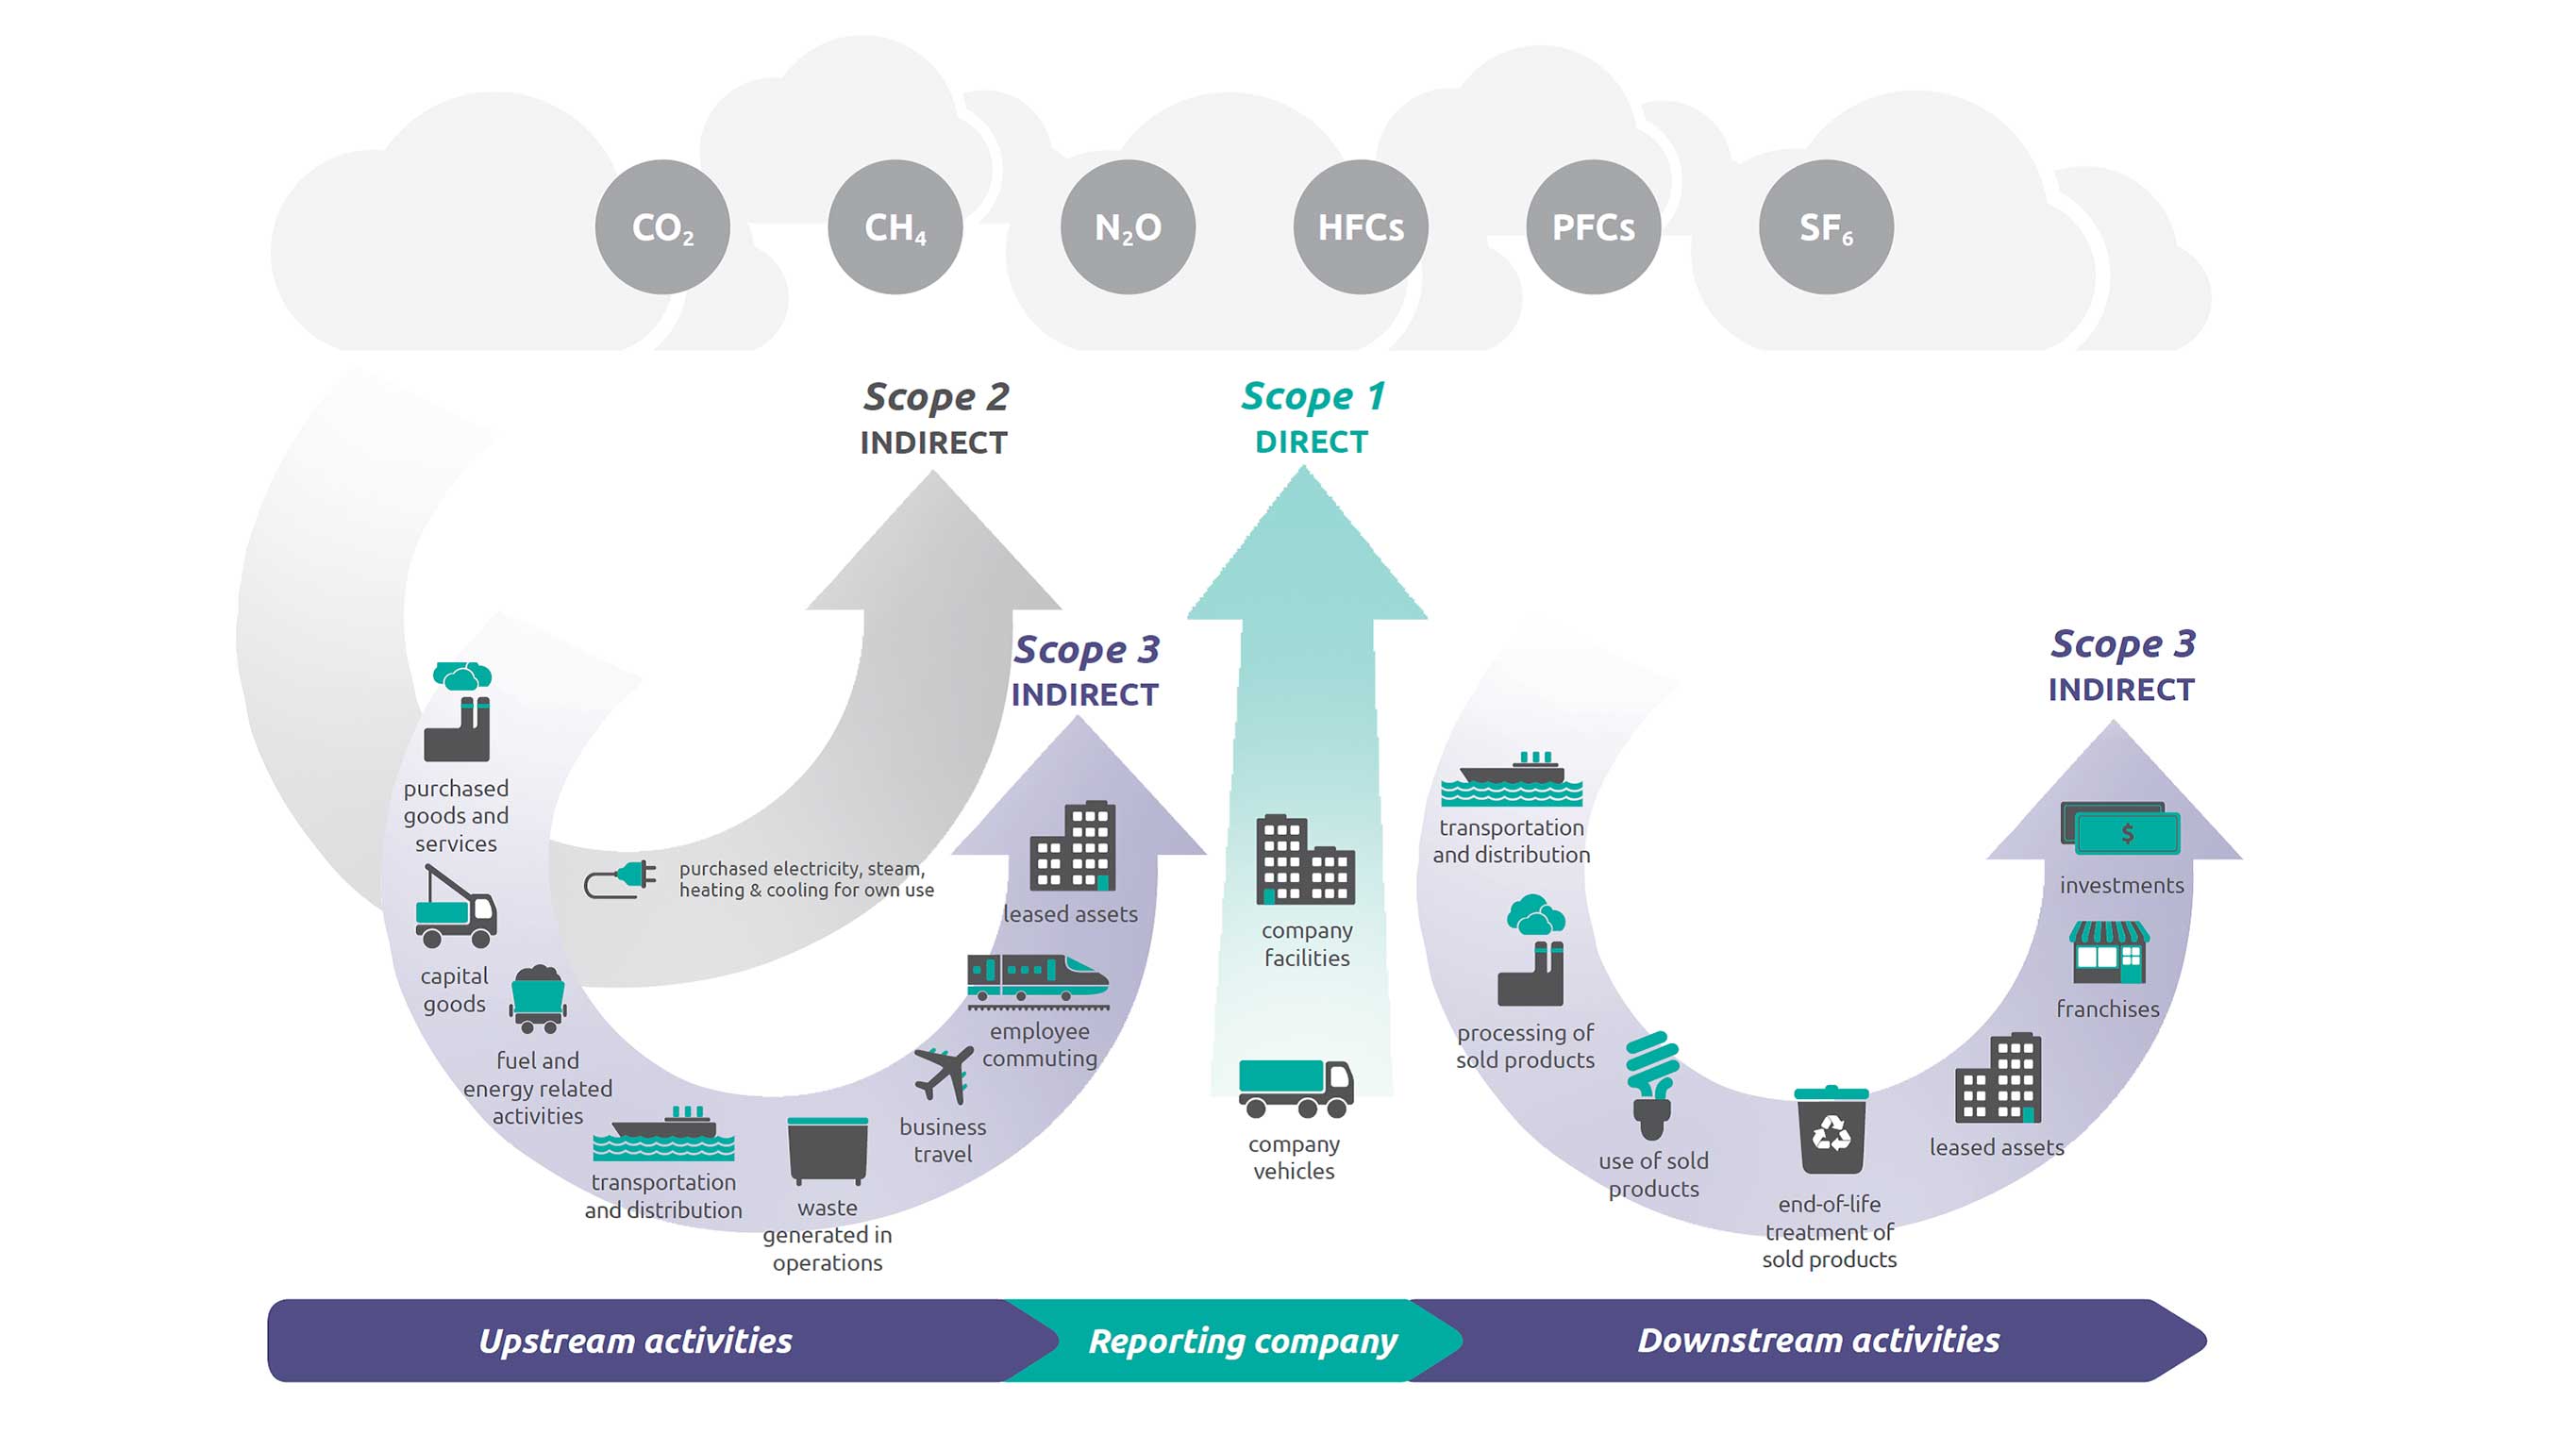
Source: GHG protocol
Our estimates include other greenhouse gases along with carbon dioxide (CO2) – you can see them listed at the top of the image above. For instance, human sources of the potent greenhouse gas methane (CH4) are focused on agriculture, waste disposal and fossil fuel production.13 Consistent with this, we divide our estimate by a global GHG figure that includes a range of GHG along with 5 GtCO2e for land use change.14
As noted above, it is crucial to have a value chain perspective when considering opportunities for climate action. For instance, food systems account for one third of greenhouse gas emissions globally, while transport emissions account for one fifth. Listed companies play important roles in these sectors: processing and selling the food we eat, and manufacturing the vehicles we drive. Much of this is missed when focusing narrowly on Scope 1.
Let’s take one company example. Amazon’s Scope 1 emissions are just under 10 MtCO2e. It’s Scope 2 emissions are just above 5 MtCO2e. Meanwhile, it’s reported Scope 3 emissions are 45 MtCO2e. This covers the footprint of own brand products but excludes other products sold by Amazon, so a more comprehensive Scope 3 figure would be much higher.15 It is not uncommon for Scope 3 to make up over 90% of a company’s GHG footprint.
The following sections explain our methodology and some of the important assumptions made. We also highlight areas where further research could build on our initial estimate.
1. Addressing double counting
Historically, double counting has made it difficult to ‘add up’ the GHG emissions of listed companies. Along a single supply chain, several organisations can be held accountable for the same tonne of GHG. In the case of a vehicle, this chain of responsibility includes an oil company producing fuel, the automotive manufacturer, and the individual or organisation that owns the vehicle. We aim to capture the share of emissions that listed companies are responsible for, while avoiding double counting.
For instance, to assess emissions from oil consumption, we first include all the oil produced by listed companies. Oil burned by listed companies is captured in their Scope 1 estimate. Our incremental Scope 3 oil estimate therefore needs to capture only the emissions from oil produced by listed companies, that is burned by non-listed businesses and households. We also estimate the share of vehicles produced by listed autos manufacturers. Finally, we assess the share of oil consumed in these vehicles that was produced by a non-listed company (for instance, by a state owned enterprise) and can therefore be added without double counting.
Similar sorts of questions arise throughout our analysis. Here are a few more examples:
- What proportion of a company’s Scope 2 emissions overlap with the Scope 1 emissions of a listed utility?
- What share of global steel production by listed companies is fuelled by state-owned coal suppliers?
- What proportion of household energy consumption is provided by listed companies?
- What share of global food production passes through listed companies at key stages in the value chain?
The flip side of double counting is that responsibility for emissions is shared rather than compartmentalised. It is important to note that while our estimate of listed company emissions are 40%, this does not mean that the total contribution of privately owned, state owned and household emissions is 60%. Think of a Venn diagram, not a pie chart.
We are working on a tool to make our assumptions fully transparent, but we are happy to discuss the methodology – and how it could be refined – with stakeholders in the meantime. More details are provided in the Appendix.
2. A conservative estimate
We have focused on producing a robust estimate, and we have erred on the side of excluding emissions where double counting was too difficult to address. In addition, our analysis is far from comprehensive. We focus on a few areas of Scope 3 that an initial scoping exercise highlighted as important, and where sufficient, reliable data is available from public sources. Future analyses can expand the methodology to cover other ways listed companies contribute to global GHG emissions.
The following three areas illustrate why we believe our calculation is likely an underestimate. A more detailed table of ‘material omissions’ is provided in Appendix 3.
End use. Apart from vehicles, we have not included the end-use of carbon-intensive products (such as air conditioning systems). The difficulty here is establishing what is already included in our estimate, by listed electricity producers (as Scope 1) and by those renting space in commercial buildings (as Scope 2).
Food and land systems. Assumptions made here can make a big difference to the estimate, due to the overall contribution of food and land systems on GHG emissions. We capture part of the global food system by looking at estimates of CH4, CO2 and nitrous oxide (N20) from land use change resulting from agriculture, using the EDGAR database. This includes calculations of deforestation.
We estimate the proportion of food sold by listed supermarkets using data on grocery scales from a range of sources. We also estimate the share of physical goods handled by commodities traders, which play a vital role in global food supplies. Two of the four major ‘ABCD’ food commodity traders, Bunge and ADM, are publicly owned. Our approach here is conservative because it only includes foodstuffs that are exported.
We have not estimated food-related emissions in the supply chain of fast moving consumer goods companies, primarily due to double counting and data availability issues. We chose not to include the share of food transported at some stage in vehicles produced by listed companies, such as Maersk ships or Scania lorries. Some of these emissions are already captured by our Scope 3 oil analysis and, in any case, this felt like a bridge too far. We also excluded energy-related emissions from our food calculations to avoid double counting.
To get a sense of how our results compare to estimates of scope 3 GHG at the company level, we compared them with CDP’s dataset. In the relevant Scope 3 category, ‘Purchased goods and services’, there is around 1 GtCO2e for companies in the food and clothing sectors. Only part of this will relate to land use change, and some non-food activity will be included. This compares with our Scope 3 estimate for food of 3 to 4 GtCO2e. This suggests that scope 3 modelling of corporate emissions is capturing only part of the story.
Financed and insured emissions. The financing and insuring of high carbon activities by listed finance sector organisations is a significant omission from our estimate, due to the lack of high quality data.
According to the NGO Rainforest Action Network, the 60 largest private sector banks provided $3.8 trillion of finance to fossil fuels in the past five years.16 The vast majority of these banks are listed, and much of the finance flows to non-listed entities that are excluded from our calculation (for instance, financing of coal production and power plants owned by non-listed firms). Similarly, listed insurance companies often provide coverage for high carbon infrastructure.
3. The Aramco question
Where to draw the line on company listings has no standard definition we are aware of, so we want to be transparent about our decisions here.
We decided to include both Saudi Aramco and Gazprom. They are both listed and, in keeping with our findings, investors in these companies therefore have a responsibility and opportunity to engage. Of course, the Saudi and Russian governments retain significant control over their corporate strategies, so others might have chosen to exclude these companies from the estimate.
It makes little difference to the overall findings. Treating both Aramco and Gazprom as state-owned reduces our overall estimate only by about 1.4% of global GHG. The lower estimate of oil production by listed companies is partly offset by an increase in oil consumption in vehicles produced by listed companies.
We also include the listed company subsidiaries of state owned oil and gas producers and power companies, which mainly arose in our analysis in the context of China.
Conclusion
As we approach COP26, let’s be clear that mobilising action across the listed company landscape will play a crucial role in closing the ambition gap on emissions reductions to 2030.
If listed companies account for 40% of the climate crisis, the potential for impact through asset management in listed equities must be huge. The true figure – and potential for impact – is likely to be even greater.
Listed companies will need to reach net zero by 2040. Action in the near term creates significant value,17 and many listed companies have the capacity to be early movers. They are very well-resourced and effective at managing change in short periods of time. Investors in listed equities and other stakeholders can accelerate progress through active engagement and capital allocation choices.
Listed companies will play a key role in a sustainable and equitable transition to net zero. It’s time for investors to prove it.
Key data sources
The key data sources used in our analysis are set out below:
-
CDP – disclosed and modelled estimates of Scope 1, 2 and 3 GHG emissions. We are grateful to CDP for allowing us to use their data for this study https://www.cdp.net/en/investor/ghg-emissions-dataset
-
Climate Accountability Institute – the Carbon Majors dataset includes data on emissions associated with coal, oil and gas production by listed and non-listed companies
https://climateaccountability.org/carbonmajors_dataset2020.html -
IEA – data on the use of energy products by sector and region of the world https://www.iea.org/data-and-statistics
-
OICA – data on vehicle manufacture by companies over time https://www.oica.net/production-statistics/
-
EDGAR-FOOD – a global emission inventory of GHG from food systems. https://edgar.jrc.ec.europa.eu/edgar_food
-
Fortune 500 – used to calculate market shares of key listed companies. https://fortune.com/global500/
In addition, we used a wide array of academic and grey literature to inform specific assumptions, such as the importance of SMEs in different regions of the world, relative shares of private versus commercial travel and share of food exports.
We are grateful to Energy Foundation China for their help with sourcing relevant information on China for this study.
All errors are the responsibility of the authors.
Assumptions and sensitivities:
In applying these data sources, we have used the latest years for which they have data available. This means that the analysis combines data from different years.
We have typically used point estimates in order to keep the analysis simple. In future, a systematic assessment should subject these to a range of sensitivity tests.
Some of the key assumptions that could be tested or where there is potential for deeper analysis include:
-
More scrutiny of the location in which the Scope 2 emissions of listed companies arise
-
Accounting for any listed companies that are likely to be excluded from various databases used in the analysis
-
The analysis uses an estimate of the importance of SMEs in the economies of different regions of the world as the main proxy for the role of non-listed companies. This is augmented by an estimate of the role of SOEs in China. Future analysis could review these assumptions and explore additional proxies for economic activity by non-listed companies.
-
Exploring the share of transport activity undertaken by households and individuals
-
Understanding further the importance of agro-processors in the food system – at present the analysis makes the conservative assumption that agro-processors are only involved in processing food that is traded internationally.
-
Testing the assumptions on the importance of subsistence agriculture.
In the table, Scope 2 and 3 are estimates of incremental emissions, after taking double counting into account.
GHG emissions of listed companies (GtCO2e)
|
|
Low |
High |
|
Scope 1 |
12.23 |
12.23 |
|
Scope 2 |
0.74 |
0.81 |
|
Scope 3 - coal |
0.46 |
0.46 |
|
Scope 3 - oil |
4.22 |
4.22 |
|
Scope 3 - gas |
1.21 |
1.21 |
|
Scope 3 - food |
3.12 |
4.14 |
|
Total |
22.0 |
23.1 |
|
% of total global emissions |
38.3% |
40.2% |
Our high and low estimates arise from uncertainties over input assumptions. In some cases they reflect different methodological approaches, which we explored to build confidence in our results through triangulation.
For instance, to calculate Scope 2, we conducted one estimate at country level and another at global level. These both have strengths and weaknesses. In this case, the differences between high and low are relatively small.
-
By country: we allocate each listed company to a particular market (normally based on country of head office) and deduct the share of emissions equal to our estimate of the share of listed power generation in that country.
-
Global: the share of emissions equal to our estimate of the weighted average share of listed power generation in all relevant countries.
|
Scope 3 category |
Examples of emissions missed |
|
Purchased goods and services |
Land use change and production emissions associated with listed food manufacturing companies purchasing inputs from non-listed companies, when these products are not sold by listed retailers |
|
Capital goods |
Process emissions e.g. from cement associated with listed companies purchasing capital goods from non-listed suppliers |
|
Fuel and energy related emissions |
Fugitive emissions associated with energy purchases by listed companies from non-listed energy producers. Aviation and marine emissions, where oil was extracted or refined by a listed company and consumed by a privately held or SOE airline or ship owner/freighter. |
|
Upstream transportation and distribution |
Emissions associated with upstream freight of products by listed companies where both freight company is not listed and the fuel is produced by a non-listed company. |
|
Waste generated in operations |
Emissions associated with waste generated by listed companies that is treated and disposed of by non-listed companies |
|
Business travel |
Emissions associated with business travel by listed companies where both the company providing travel services is not listed and the fuel use for transportation is produced by a non-listed company |
|
Upstream leased assets |
Energy and process (e.g. cement) emissions associated with use of leased assets by a listed company, if the emissions do not derive from production by listed companies |
|
Downstream transportation and distribution |
Emissions associated with downstream freight of products by listed companies where both the freight company is not listed and the fuel is produced by a non-listed company |
|
Processing of sold products |
Emissions associated with products sold by listed companies where downstream processing is undertaken by a non-listed company using energy sources also derived from non-listed companies |
|
Use of sold products |
Appliances manufactured by listed companies and used by final consumers or non-listed companies that rely on electricity or other energy sources derived from non-listed energy producer |
|
End of life treatment of sold products |
Food waste emissions associated with the food manufactured by listed companies, where that food is not sold by listed retailers |
|
Downstream leased assets |
Energy emissions associated with the use of leased assets that are owned by a listed company, if those leased assets are not used by a listed company and the energy emissions derived from energy products produced by non-listed companies |
|
Franchises |
Land use and production emissions associated with food sold in franchises of listed companies Energy emissions associated with franchised operations of listed companies, where energy derives from non-listed companies |
|
Investments / financed emissions |
Emissions associated with investments made by listed companies in non-listed companies, where those emissions arise from energy and food production, or other activities, undertaken by non-listed companies |
- In general, listed companies will need to be net zero by 2040 at the latest. Sectors will however move at different speeds – the power sector, for instance, will need to be net zero well before 2040, while companies in harder-to-abate areas may reach net zero later than 2040.
- This 57.4 GtCO2e figure includes land use change, estimated at 5 GtCO2e per year. As well as CO2, it includes methane and other greenhouse gases. See the PBL Netherlands Environmental Assessment Agency website for details.
- This contains both disclosed data and modelled estimates by CDP. See the published methodology.
- The scope 3 emissions are also only those that are incremental to our estimate of Scope 2 emissions
- See the MSCI publication for details (page 8).
- CDP data (analysed by Generation) and MSCI’s publication given estimates of listed companies at around 20% of global GHG, based on Scope 1. A 2017 analysis by CDP, for its Carbon Majors report, estimates that listed companies are 30% of GHG in 2015. This uses a denominator that is only a subset of global GHG emissions. Applying a denominator consistent with ours, the relevant figure is 17%. An analysis by David Fickling and Elaine He for Bloomberg has a figure of 15%.
- Our estimate of listed company GHG is roughly 2x the Scope 1 estimate using either CDP or MSCI data. This is much lower than the 5.5x figure from CDP, due to double counting in GHG statistics (a design feature rather than a flaw). Scope 2 and 3 emissions of companies in CDP’s database are often the Scope 1 emissions of another company.
- See this Carbon Brief article on the extent of global land use change
- Ricciardi et al (2018), ‘How much of the world's food do smallholders produce?’. Global Food Security. See paper
- Carbon Tracker (2021), ‘Flying Blind: Flying blind: The glaring absence of climate risks in financial reporting’. See report
- See Climate Trace website
- There are 40 thousand listed companies according to the OECD. We are referring here to the MSCI ACWI Investable Market Index (IMI) which captures large, mid and small cap representation across 23 Developed Markets and 27 Emerging Markets countries. This currently has 9,225 constituents, covering approximately 99% of the global equity investment opportunity set, according to MSCI.
- Saunois et al (2020), ‘The Global Methane Budget 2000–2017’. Earth Syst. Sci. Data. See paper
- Methodologies for accounting for agriculture and nature based solutions are still evolving. See this update
- See Amazon website
- RAN (2021), ’Banking on Climate Chaos’. See report
- See Generation’s insights piece on the Time Value of Carbon
Important Information
The ‘Insights 06: Listed Company Emissions' is a report prepared by Generation Investment Management LLP (“Generation”) for discussion purposes only. It reflects the views of Generation as at October 2021. It is not to be reproduced or copied or made available to others without the consent of Generation. The information presented herein is intended to reflect Generation’s present thoughts on net zero and related topics and should not be construed as investment research, advice or the making of any recommendation in respect of any particular company. It is not marketing material or a financial promotion. Certain companies may be referenced as illustrative of a particular field of economic endeavour and will not have been subject to Generation’s investment process. References to any companies must not be construed as a recommendation to buy or sell securities of such companies. To the extent such companies are investments undertaken by Generation, they will form part of a broader portfolio of companies and are discussed solely to be illustrative of Generation’s broader investment thesis. There is no warranty investment in these companies have been profitable or will be profitable.While the data is from sources Generation believes to be reliable, Generation makes no representation as to the completeness or accuracy of the data. We shall not be responsible for amending, correcting, or updating any information or opinions contained herein, and we accept no liability for loss arising from the use of the material.